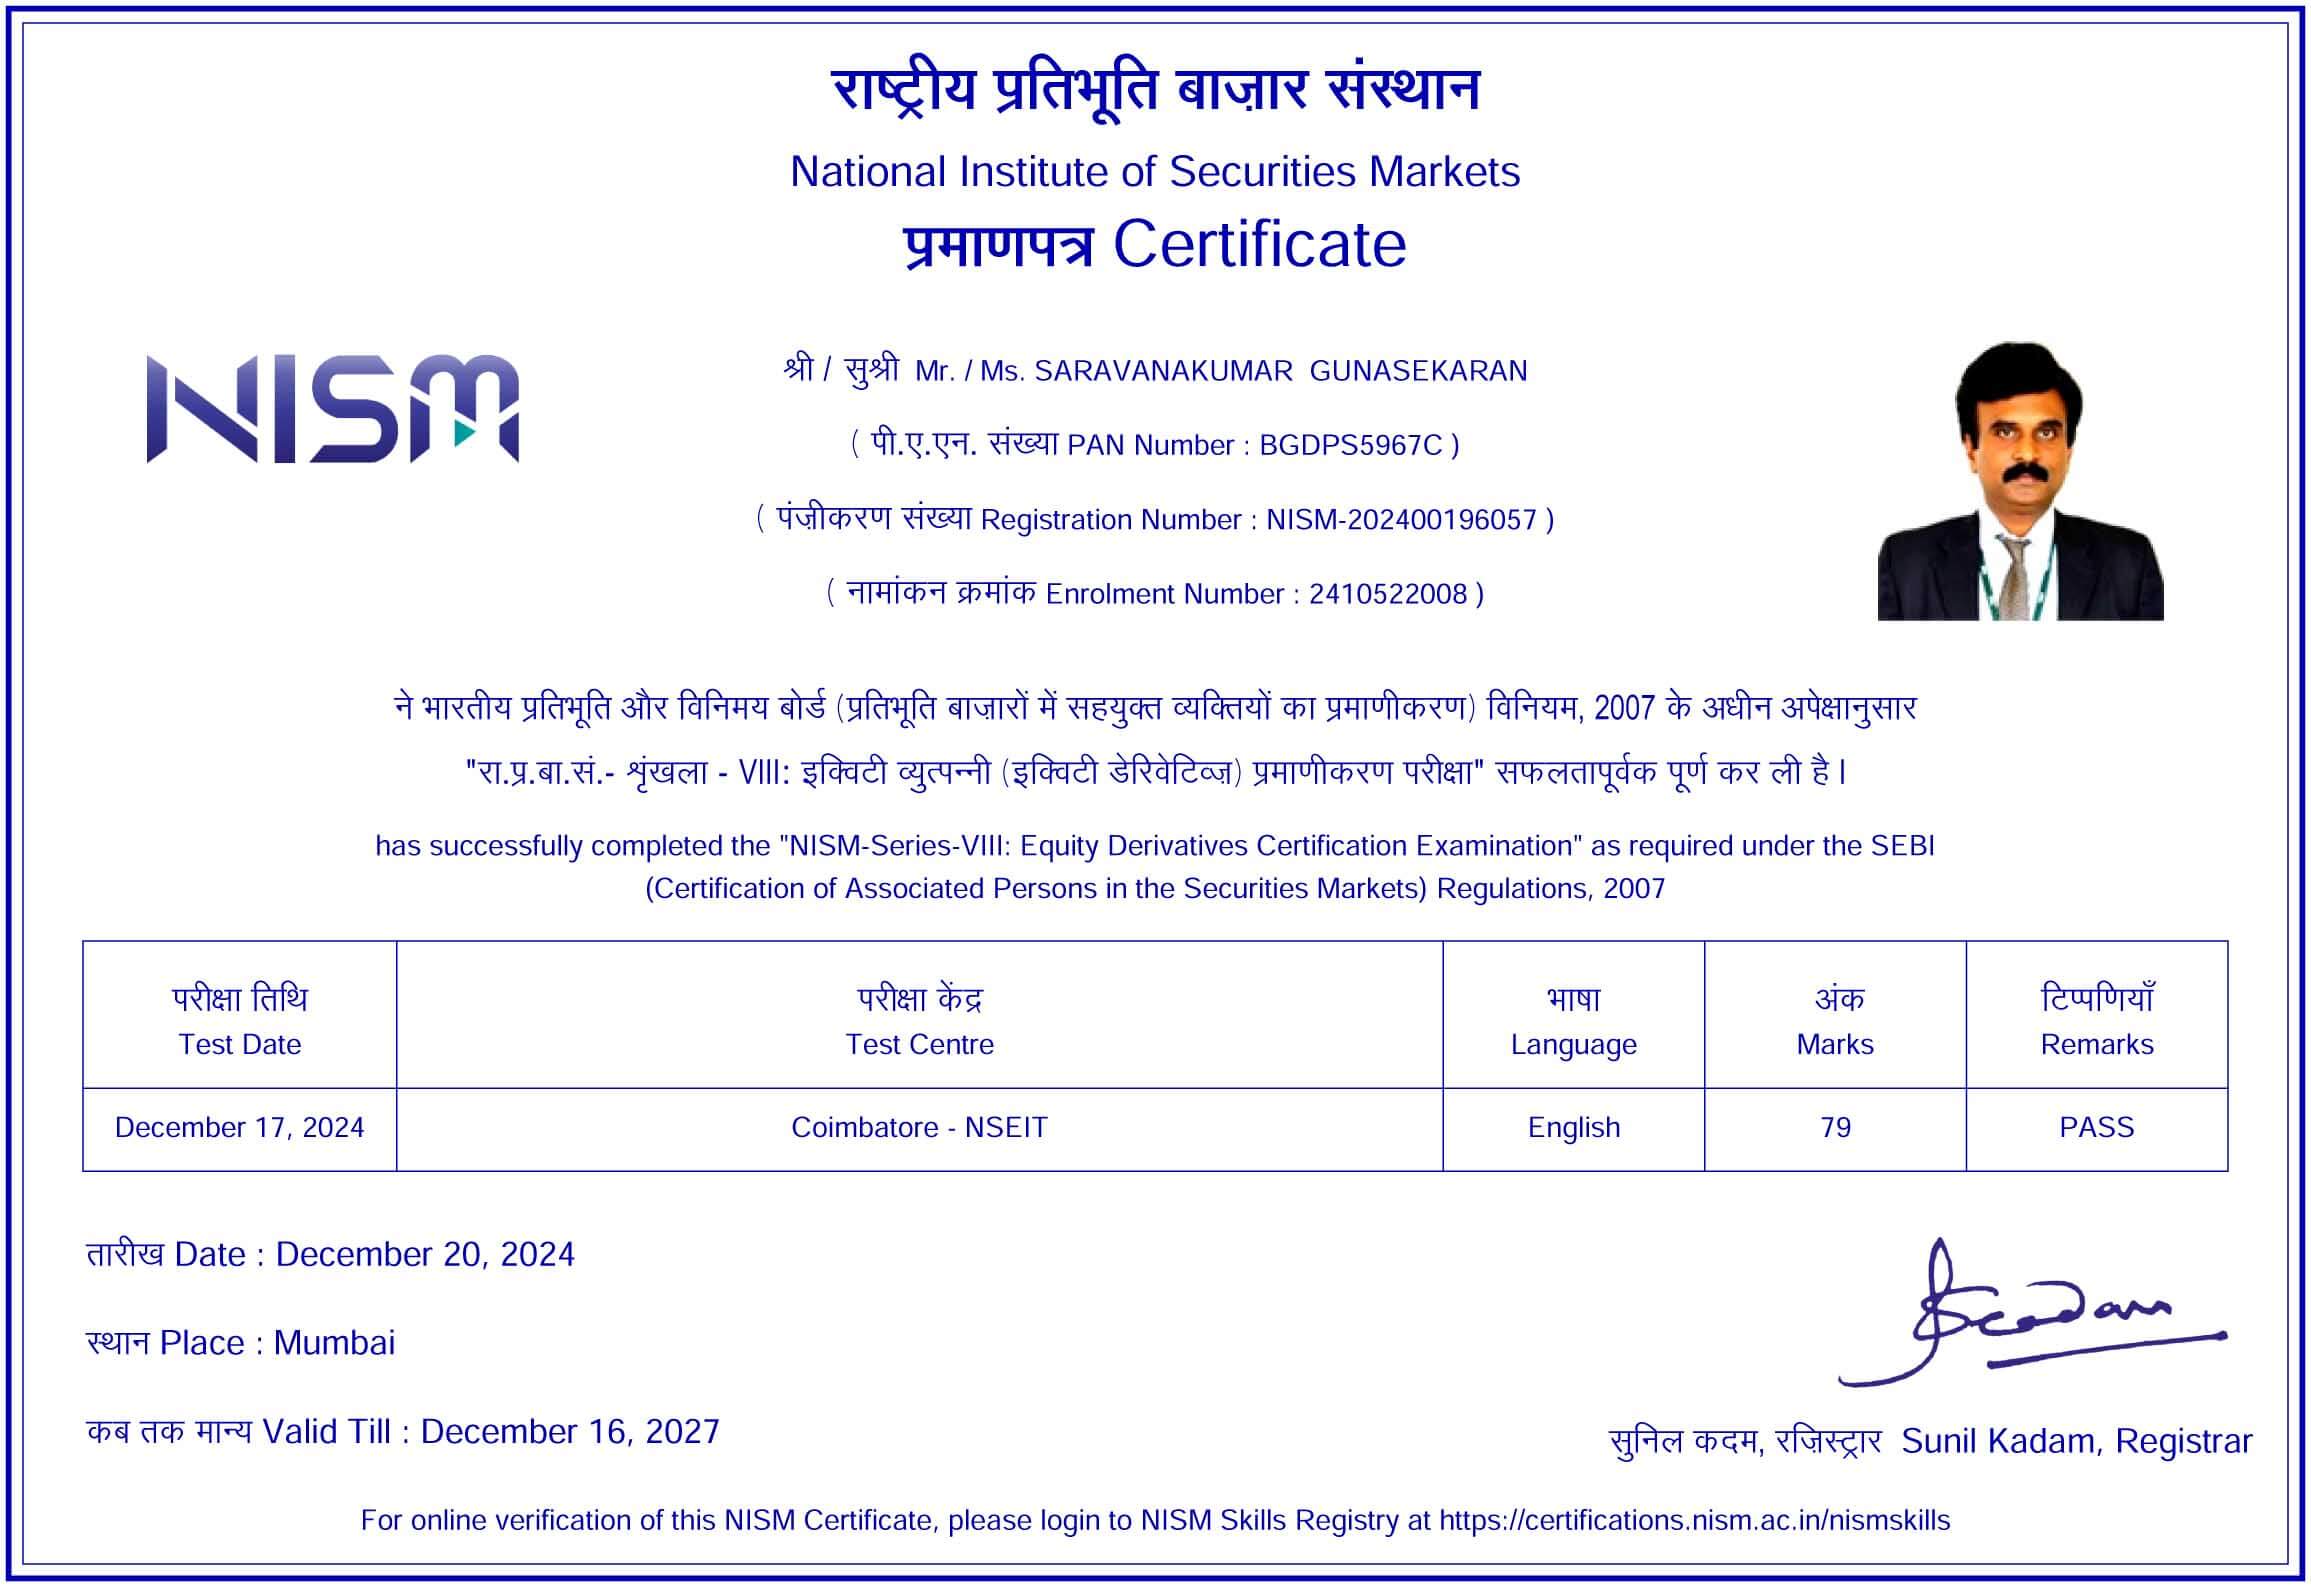
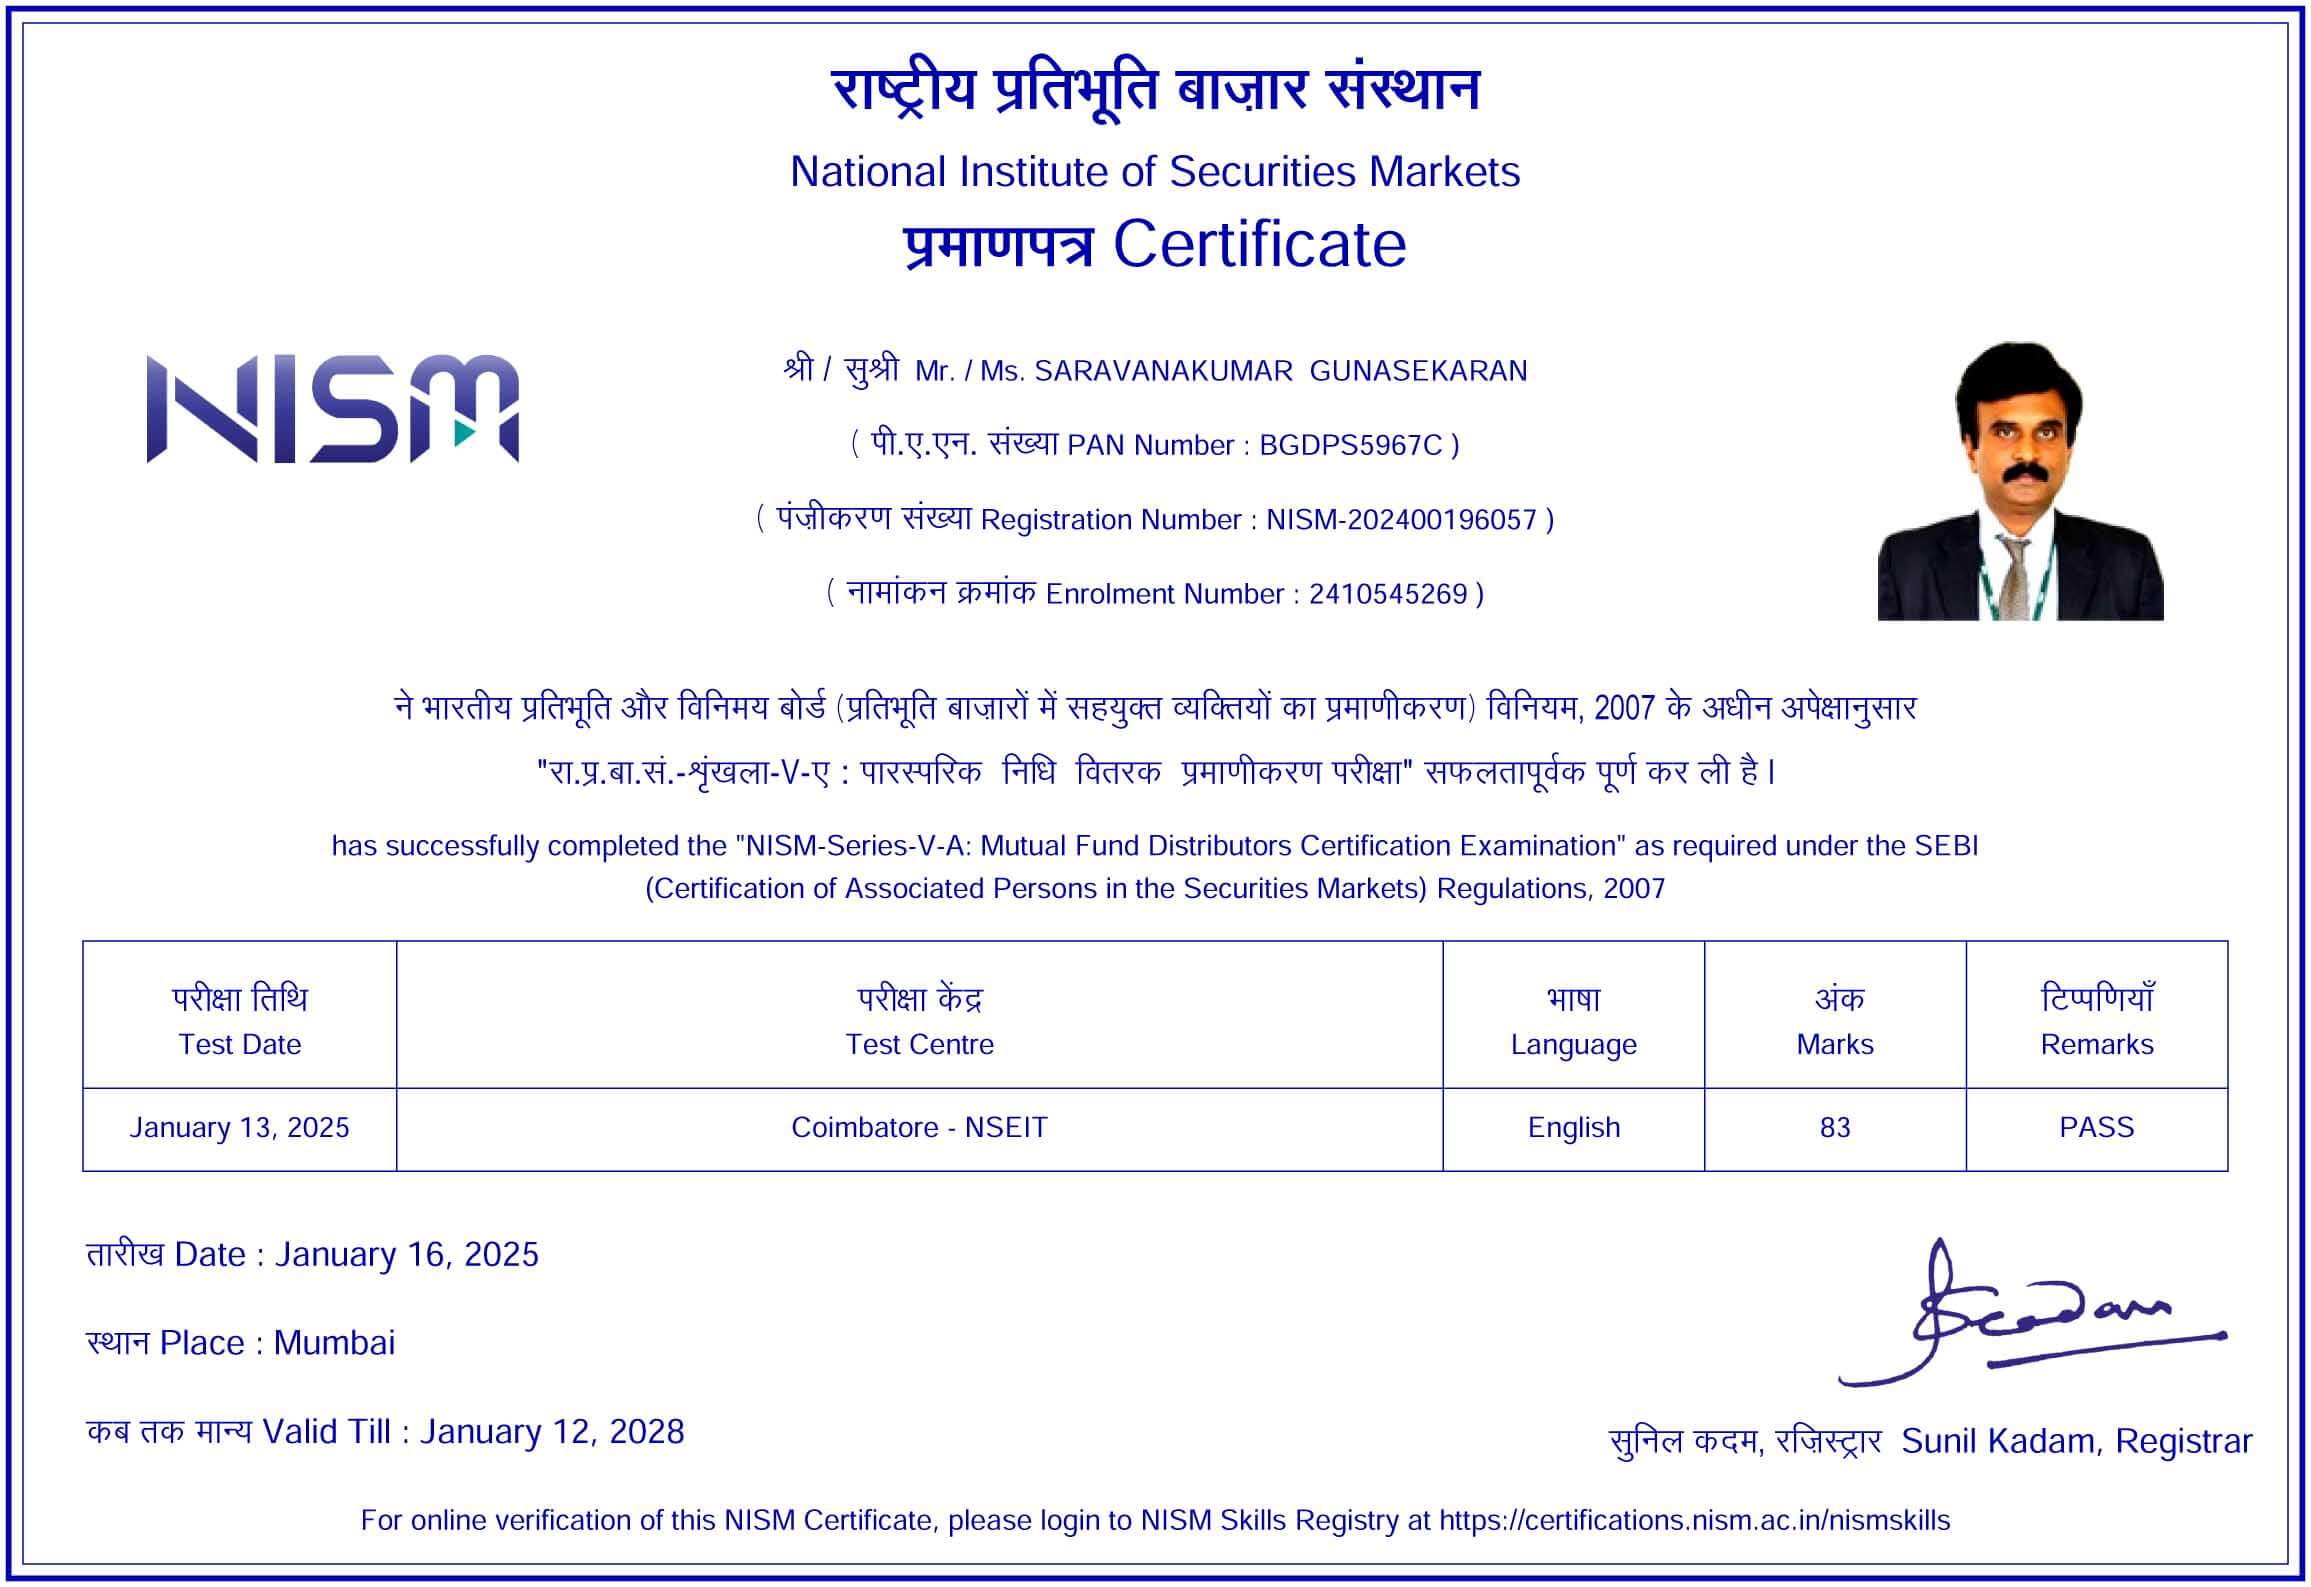
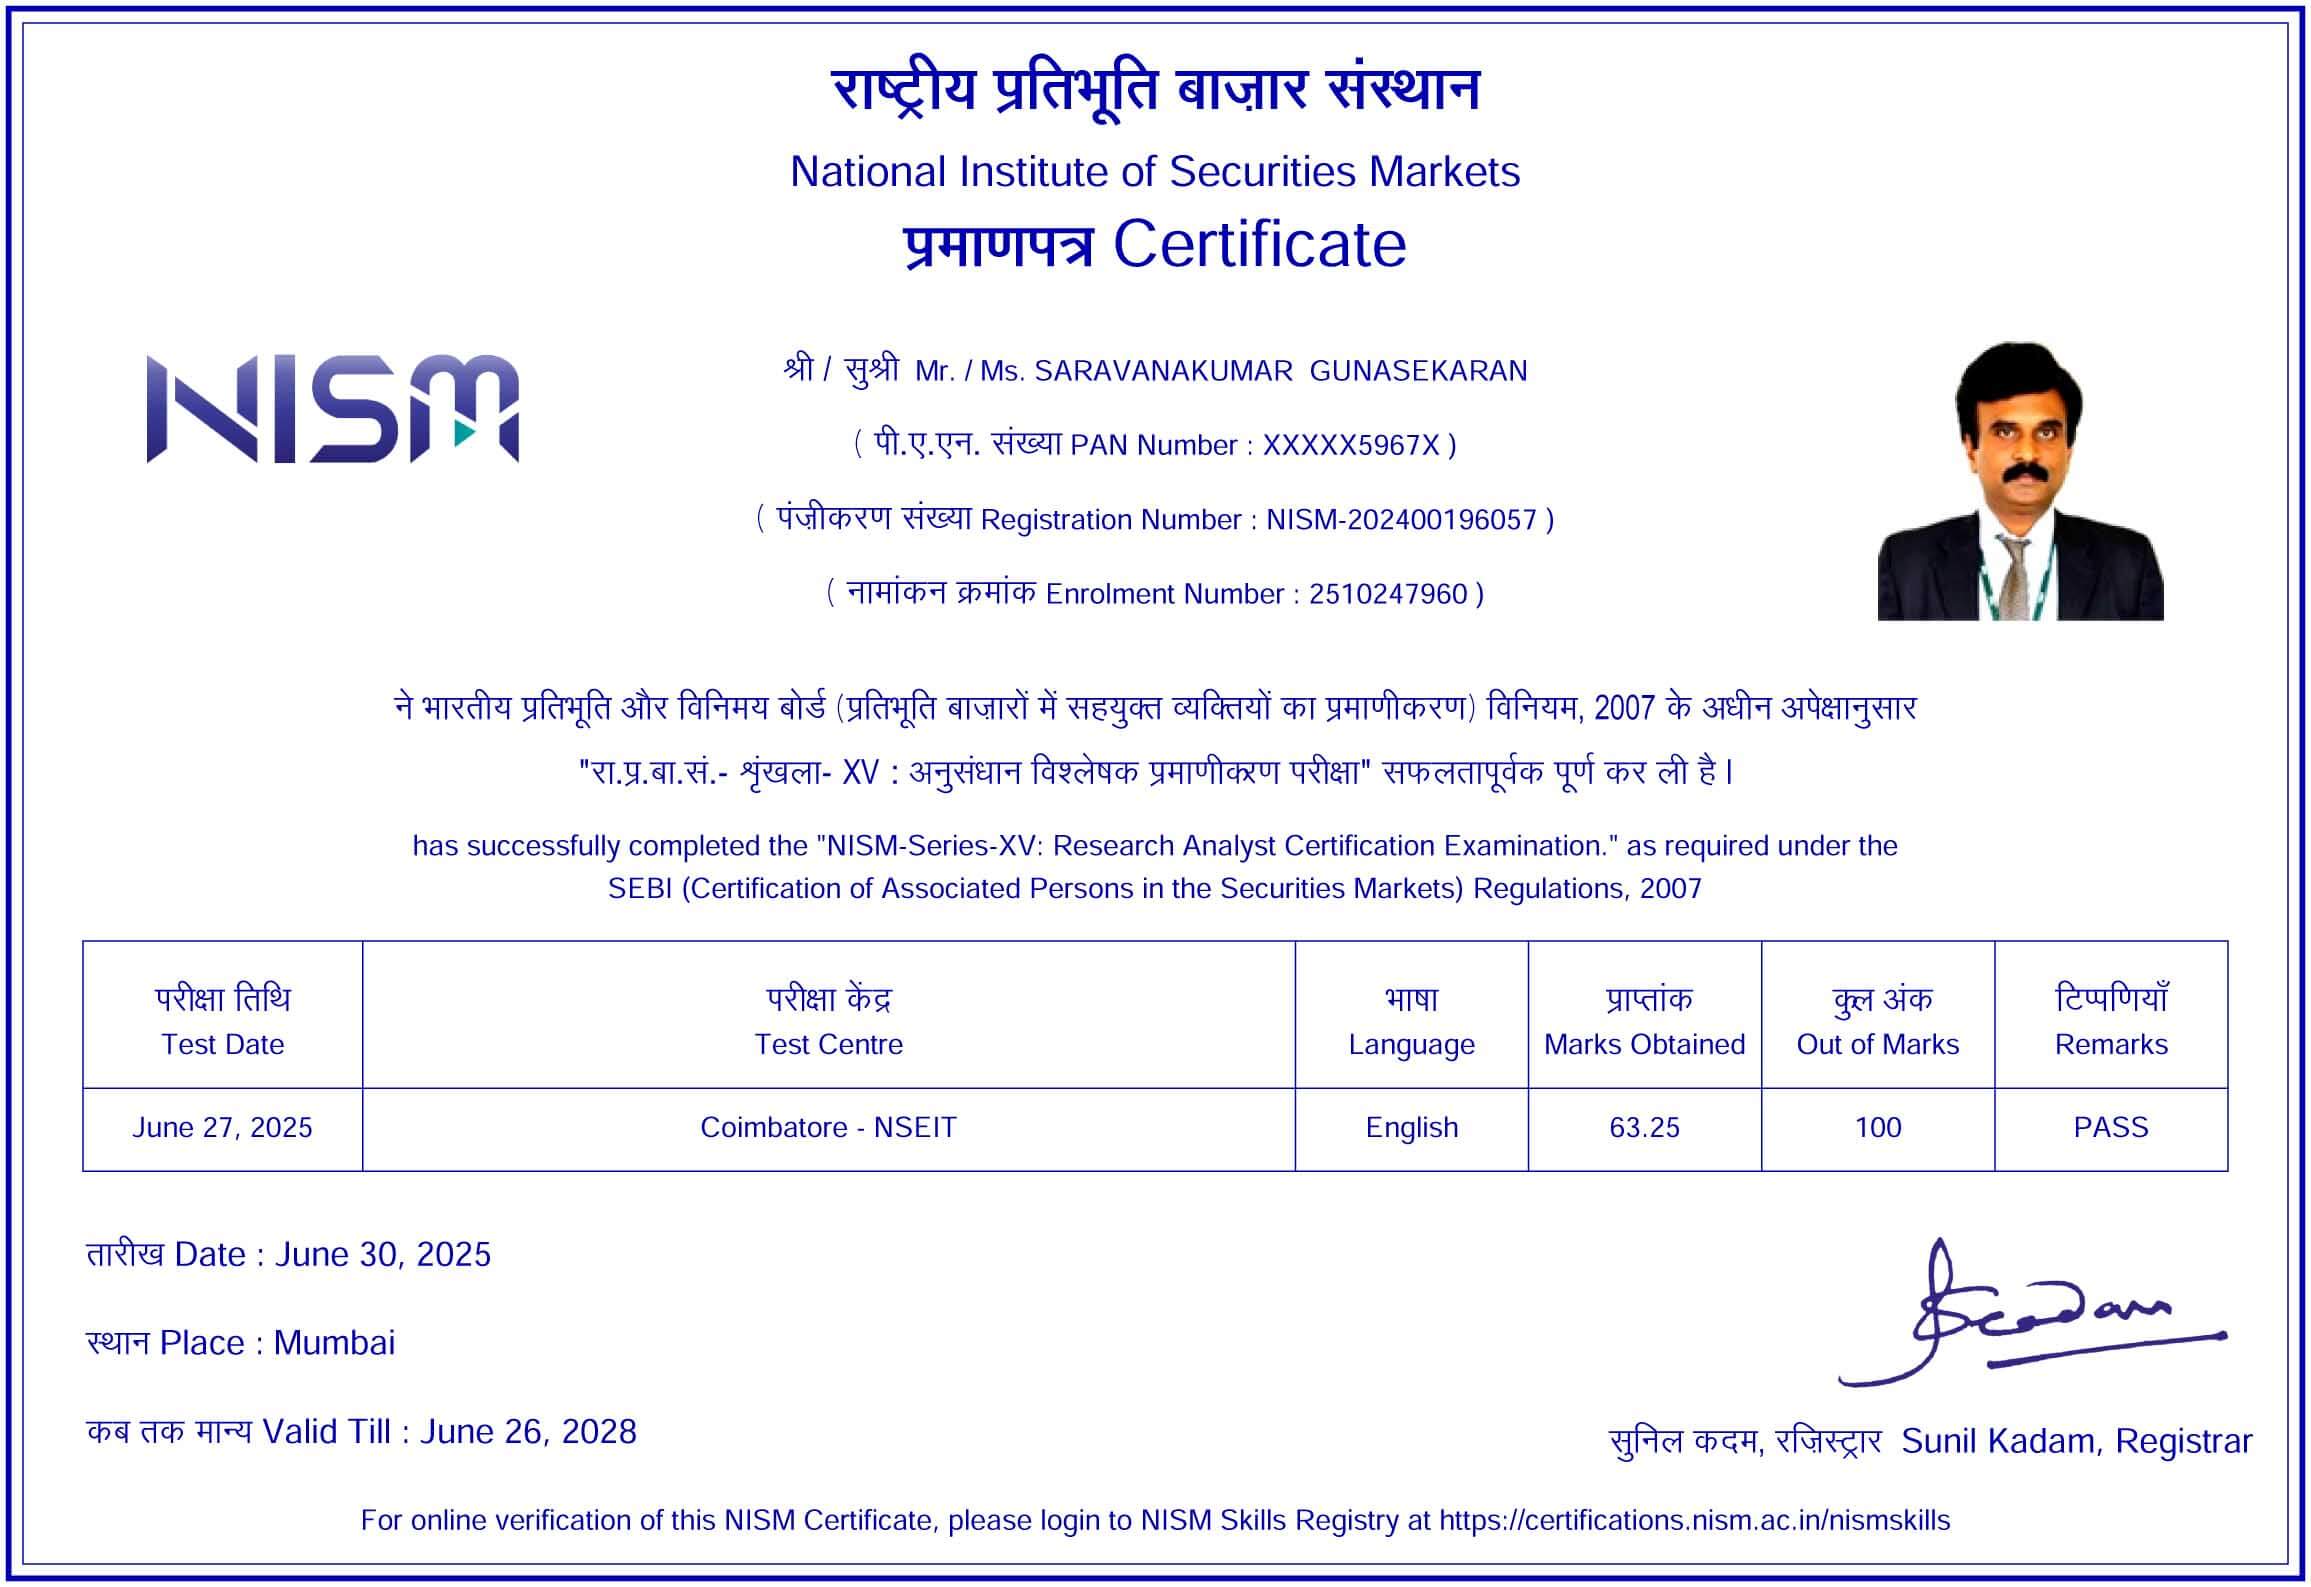
Stock Market Technical Analysis Course

The Majority of People trade stocks through referrals, thereby making uninformed decisions. As a result, lose money in trades. Nevertheless, practicing trading without formal knowledge is gambling.
Technical analysis methods can be used to investigate how the demand and supply for specific securities affect price, volume, and implied volatility swings. It is based on the notion that historical trading activity and price movements in securities can be used as meaningful indications.
This course covers technical analysis approaches, chart reading skills, common chart patterns, gap analysis, candlestick patterns, and interpreting technical indicators and oscillators. Students will practice these techniques through hands-on software sessions in chart formations, indicators, global cues, and FII patterns. The goal is for the learners to learn, practice, and earn by applying technical analysis strategies.
Savings and Investment, Types of Investments.
Share: Concept and types, Participants in the Share market.
SEBI- Powers and functions, Capital Market: Primary Market, Secondary Market.
Demat Account Opening- Requirements, Types of Brokers.
Stock Market Terminologies: Bonus share, stock split, Dividend, Market Trends, Correction, Crash, Types of Trading, Types of Order.
Factors affecting the stock market.
Types of Charts, Candle formation, Types of Candles, Candlestick pattern.
Chart Patterns- Reversal pattern and Continuation Pattern, Bilateral Patterns.
Basics of Intraday, Futures & Options.
Technical Indicators: Moving averages, MACD, RSI.
Fibonacci Retracement and Human Psychology.
Exact Entry and Exit points techniques.
Trading View – Advanced Charting tools, Technical Indicators.
Available Trading platforms for Intraday, futures, and Options trading.
Available simulation Trading platforms for Trading stocks.


